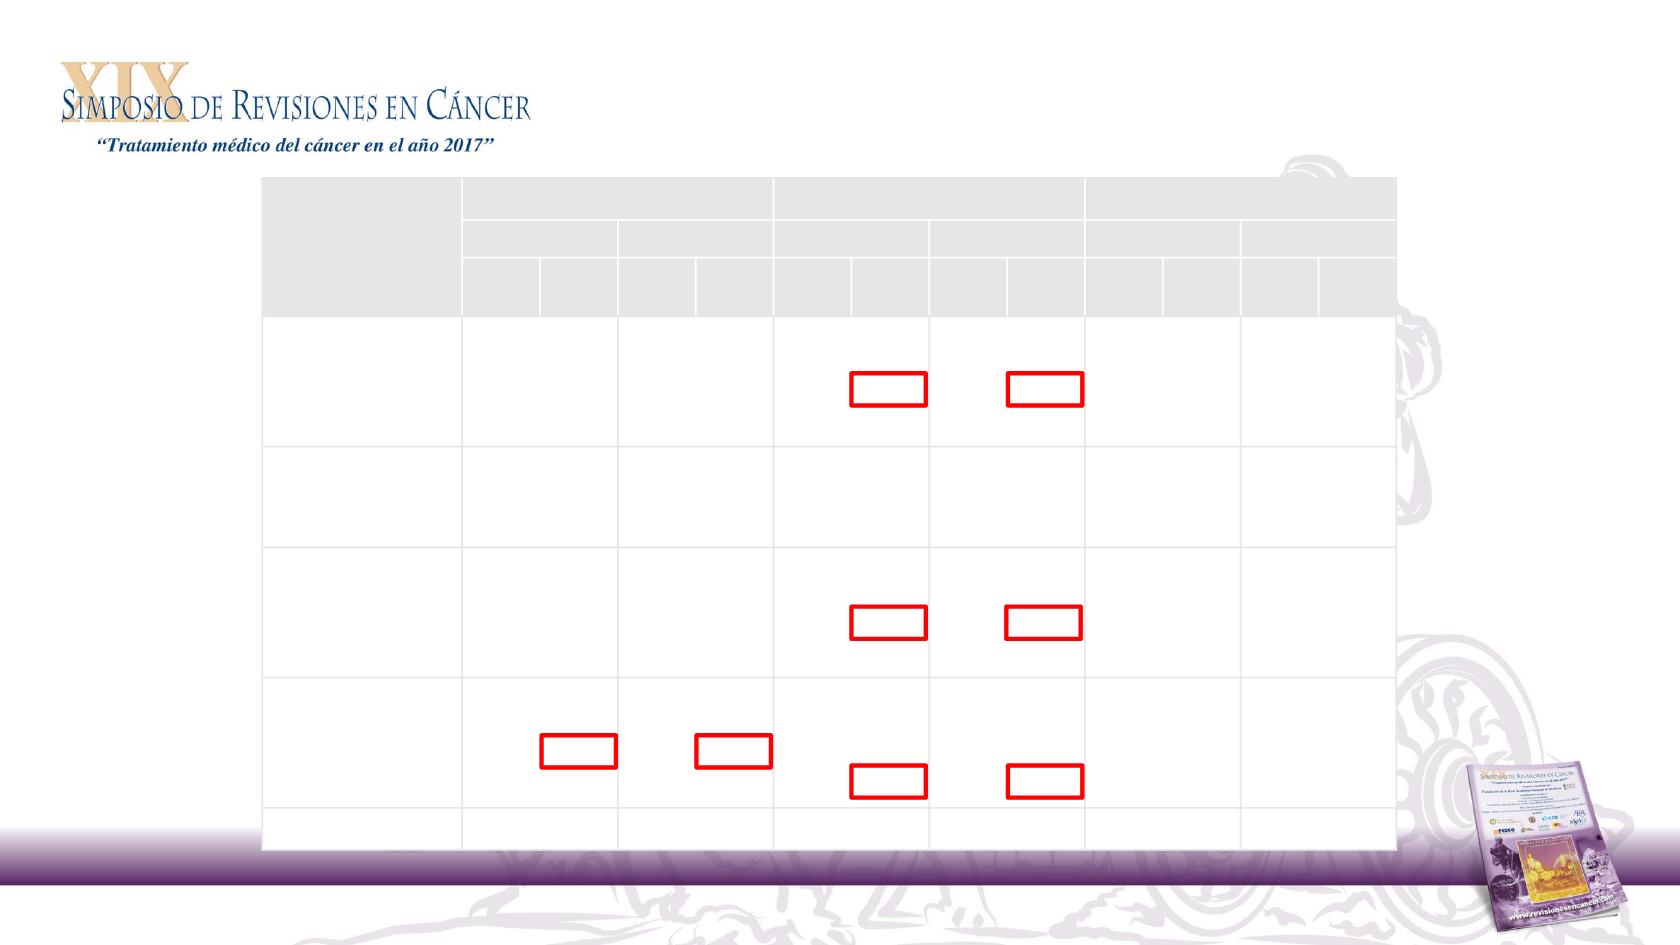
Panitumumab outcome by tumour location analysis
Baseline characteristics
•
Boeckx N, et al. Ann Oncol 2016;27(Suppl 6):abstract 89P (and poster).
•
Met, metastatic; yrs, years.
WT
RAS
PRIME
PEAK
Study 181
Pmab + FOLFOX
FOLFOX
Pmab + FOLFOX Bev + FOLFOX
Pmab + FOLFIRI
FOLFIRI
Left
(n = 169)
Right
(n = 39)
Left
(n = 159)
Right
(n = 49)
Left
(n = 53)
Right
(n = 22)
Left
(n = 54)
Right
(n = 14)
Left
(n = 150)
Right
(n = 31)
Left
(n = 148)
Right
(n = 39)
ECOG PS, %
0
1
2
62.7
33.1
4.1
56.4
38.5
5.1
55.3
38.4
5.7
55.1
38.8
6.1
69.8
30.2
-
45.5
54.5
-
64.8
35.2
-
64.3
35.7
-
52.0
44.0
4.0
35.5
54.8
9.7
52.0
41.2
6.8
48.7
43.6
7.7
Prior adjuvant, %
No
Yes
82.8
17.2
74.4
25.6
83.6
16.4
79.6
20.4
84.9
15.1
81.8
18.2
75.9
24.1
71.4
28.6
76.7
20.7
67.7
29.0
83.8
16.2
82.1
15.4
BRAF
status, %
Mutant
Wild type
Failure
4.1
92.3
3.6
33.3
66.7
0
5.0
93.1
1.9
32.7
65.3
2.0
1.9
98.1
-
40.9
59.1
-
1.9
98.1
-
7.1
92.9
-
4.7
95.3
-
29.0
71.0
-
2.7
97.3
-
33.3
66.7
-
Met sites, %
Liver + other
Liver only
Other only
70.4
19.5
10.1
53.8
15.4
30.8
67.9
19.5
12.6
71.4
10.2
18.4
39.6
34.0
26.4
59.1
18.2
22.7
38.9
27.8
33.3
64.3
28.6
7.1
68.0
19.3
12.7
64.5
9.7
25.8
60.8
24.3
14.9
69.2
12.8
17.9
Median age, yrs
61
62
62
61
60
64
60
66
61
60
60
62


