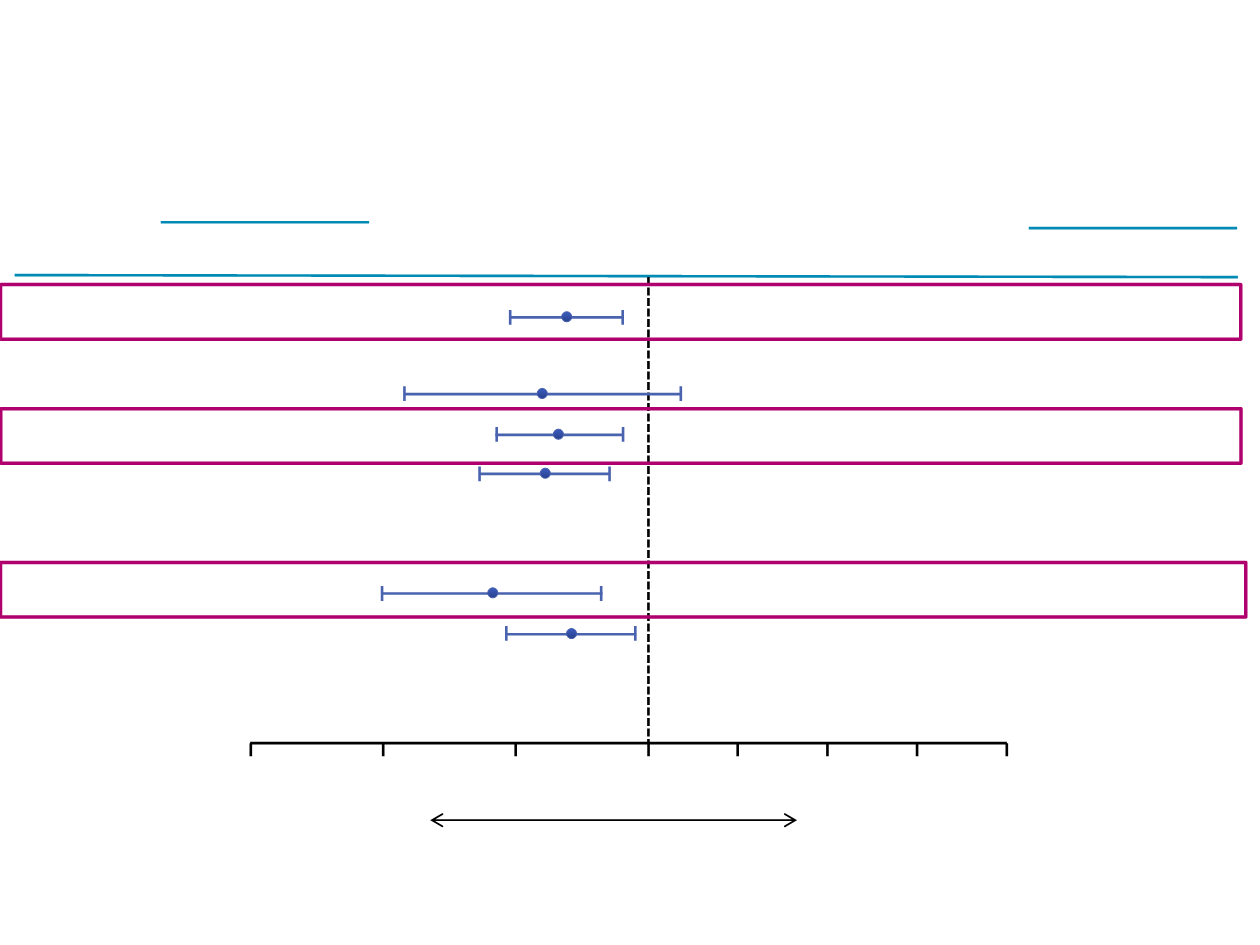
Pooled data analysis:
Overall survival in HER2
subgroups
*
Additionally stratified by triple-negative status
Overall
HER2 status
Positive
Negative
Negative*
TNBC patients
Yes
No
662/802
110/123
467/572
467/572
162/185
441/543
832/1062
139/169
581/748
581/748
201/243
543/707
0.853 (0.768, 0.948)
0.815 (0.624, 1.063)
0.841 (0.743, 0.952)
0.819 (0.722, 0.929)
0.741 (0.599, 0.917)
0.862 (0.757, 0.981)
0.0031
0.1345
0.0062
0.0019
0.0056
0.0243
HR (95% CI)
P value
Eribulin Control
Event/N
Subgroup
1.0
1.2
1.4
1.6
1.8
0.8
0.6
0.4
Eribulin Control
Median OS
(months)
15.2
13.5
15.2
15.2
12.9
15.7
12.8
12.2
12.3
12.3
8.2
13.7
Favours eribulin
Favours control


